Sunday, 26 Jul, 2026
India Tracker
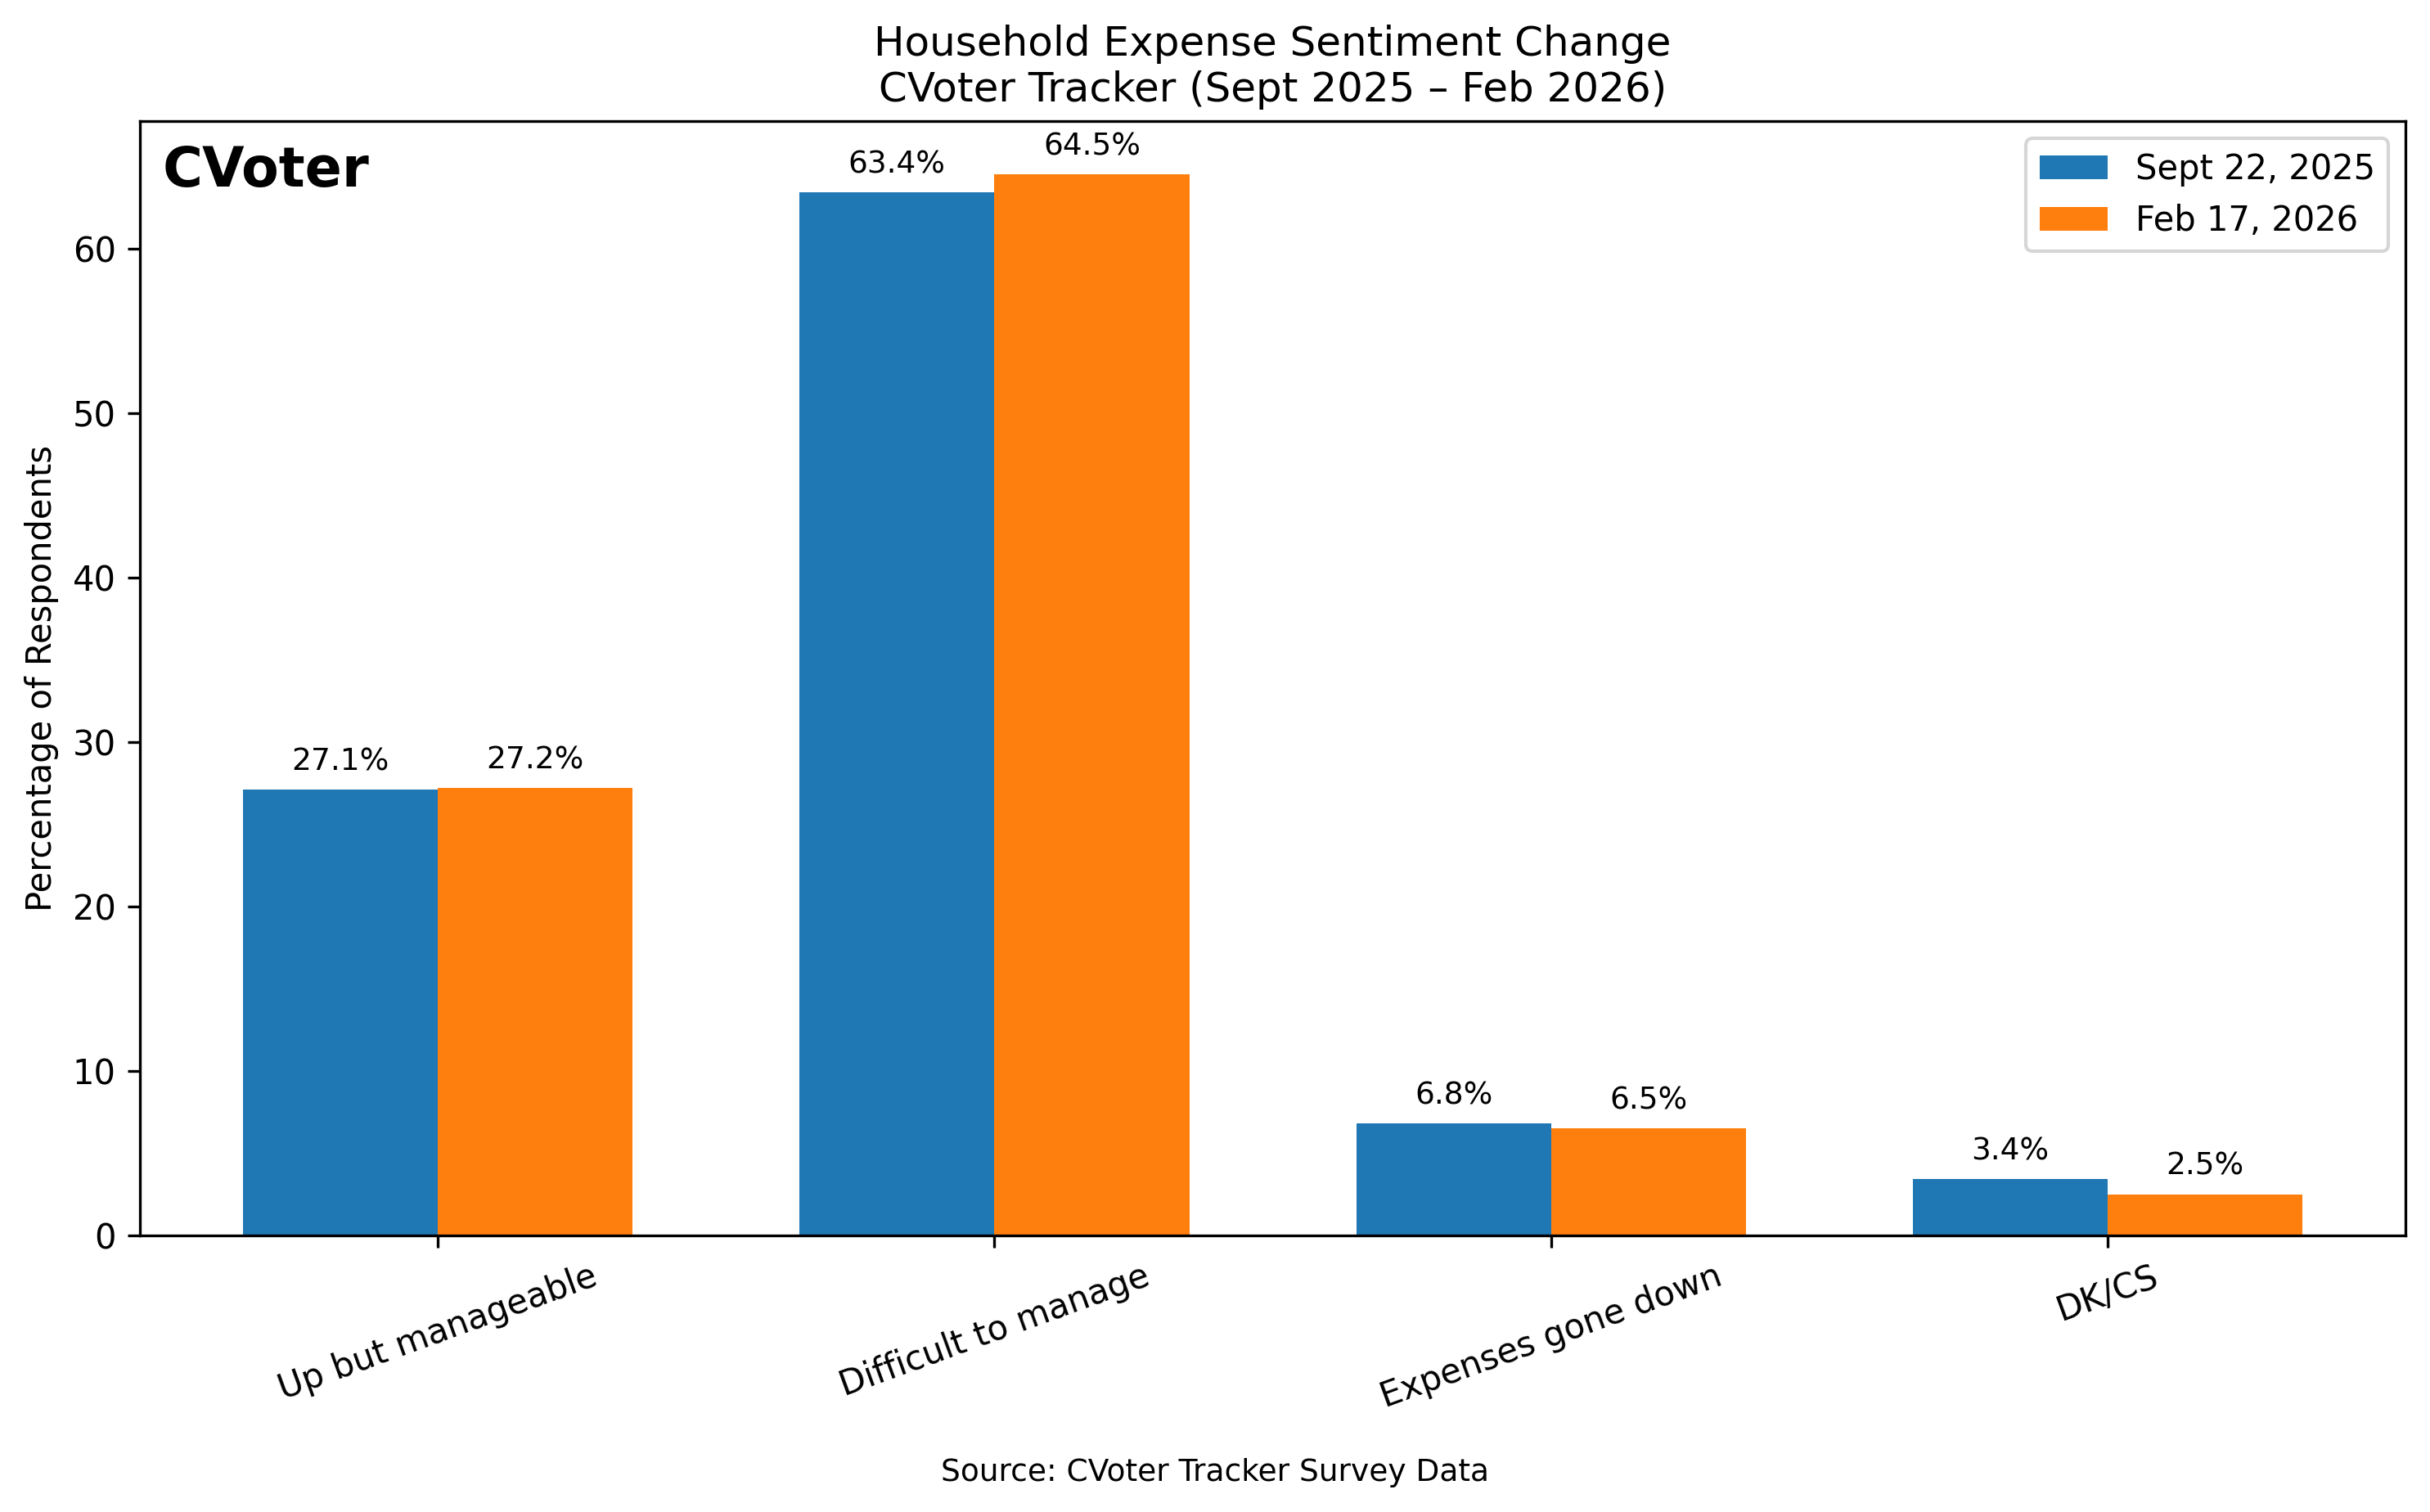
In Sept ’25, 63.4% respondents said expenses were difficult to manage. By February 17, 2026, that number had risen to 64.5%.
Despite headline relief measures and easing inflation, household budgets across India remain under visible strain.
On September 22, 2025, major GST relief measures were announced with the promise of lowering the burden on everyday consumption. At that time, CVoter Tracker reached out to over 33,000 people, 63.4% of respondents reported that their daily expenses had become “difficult to manage” compared to the previous year. Five months later, by February 17, 2026, that number had inched up further to 64.5%.
The shift may appear marginal — just over one percentage point — but in public sentiment data captured by the CVoter Tracker, such movement signals persistence rather than recovery. Instead of improvement following tax relief, financial stress has deepened.
Meanwhile, the proportion of respondents who said expenses were “up but manageable” remained almost unchanged: 27.1% in September versus 27.2% in February. CVoter Tracker found that this stagnation suggests that relief measures did not meaningfully expand the share of households feeling financially stable.
Even more striking is the small and slightly declining group reporting improvement. Those who said expenses had “gone down” slipped from 6.8% to 6.5%. The share of respondents who were unsure (DK/CS) also fell from 3.4% to 2.5%, indicating that more households are forming clear — and largely negative — views about their financial condition.
All of this is unfolding during a period of relatively low inflation, which traditionally eases cost pressures. The expectation would be a gradual improvement in household perception. Instead, the data points to resilience in financial stress.
The numbers suggest that while macroeconomic indicators may be stabilising, microeconomic realities remain tight. For a majority of Indian families, the monthly arithmetic still feels unforgiving — tax relief notwithstanding.