Saturday, 25 Jul, 2026
By: Sutanu Guru
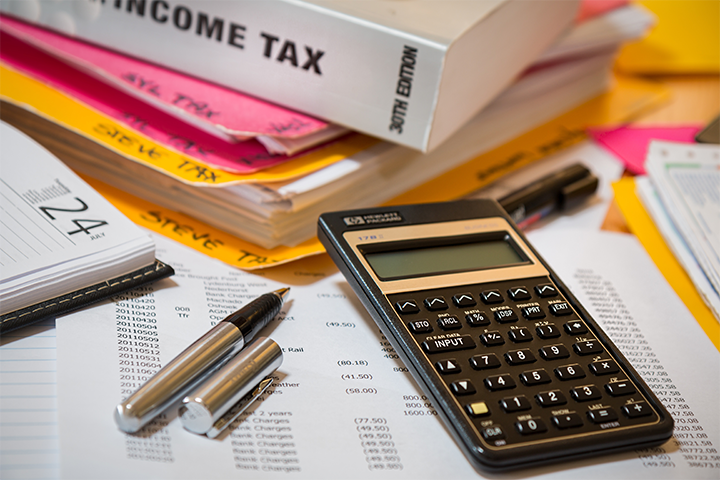
The retail inflation rate has been higher than 6% for a long time. Image Source: IANS
Since April this year, when the current financial year commenced, the consumer price inflation has been consistently above the self imposed “tolerable limit” of 6% fixed by the Reserve Bank of India
Sometime next week, the Ministry of Statistics & Program Implementation will release the consumer price inflation data for the month of September, 2022. Since April this year, when the current financial year commenced, the consumer price inflation has been consistently above the self imposed “tolerable limit” of 6% fixed by the Reserve Bank of India. In fact, the retail inflation rate has been higher than 6% for a long time now. This has compelled the RBI to raise repo rates cumulatively by 1.9% since May, 2022 in a series of moves designed to curb inflationary pressures in the Indian economy. Quite naturally, analysts and policy makers will have an eye out for what the September data says. Will the consumer inflation rate stay at the 7% mark registered in August? Will it climb further raising more alarm bells or will it moderate giving relief and more room to the RBI and the Ministry of Finance?

While attention is focused on the big picture, many analysts have gored a fascinating aspect of consumer price inflation in India this year. That is the unusually large difference between inflation rates across states of India. In any economy that encompasses a large geographical base, it is inevitable for different regions and states to have varying rates of inflation. But the differences displayed by Indians states are unusually and disturbingly large. As the accompanying chart shows the inflation rate in West Bengal in August (8.93%) was more than double the inflation rate in Delhi (4.16%). A difference of say 1% between two states can be easily explained by the prevalence of local factors. But a difference of almost 5% reveals gross distortions in the economy. A quick glance at the data (https://www.mospi.gov.in/documents/213904/416359//CPI%20Press%20Release%20Aug%2020221662984023598.pdf/ff539fa3-5758-bb1a-d53b-f62ceb8bcbbb) would suggest that perhaps consumer inflation rates tend to be higher in states with high per capita incomes and consequently more purchasing power and demand for goods and services that exerts an upward pressure on prices. But that’s not the case. Himachal Pradesh with a very high per capita income reported an inflation rate of 4.88% in August while Uttar Pradesh with a low per capita income reported an inflation rate of 7.62%.
When the GST regime was launched in India more than five years back on July 1, 2017, many analysts and economists lauded the fact that the Indian economy had finally become one unified market 70 years after freedom. Not only was the GST regime meant to end the nightmare of a bewildering multiplicity of state level excise and sales tax rates, it was also expected to drastically reduce price levels for goods and services across states. Clearly, that has not happened. Some economists say that varying freight costs (petrol & diesel still have state imposed sales tax), geographical distances and overall food grains supply management of various state governments results in varying rates of inflation. That might be partially true. But that simply cannot explain a 100% difference in inflation rates between two states.
Perhaps economists need to dig deeper and do some serious data driven research to explain this mystery.