Friday, 23 Oct, 2026

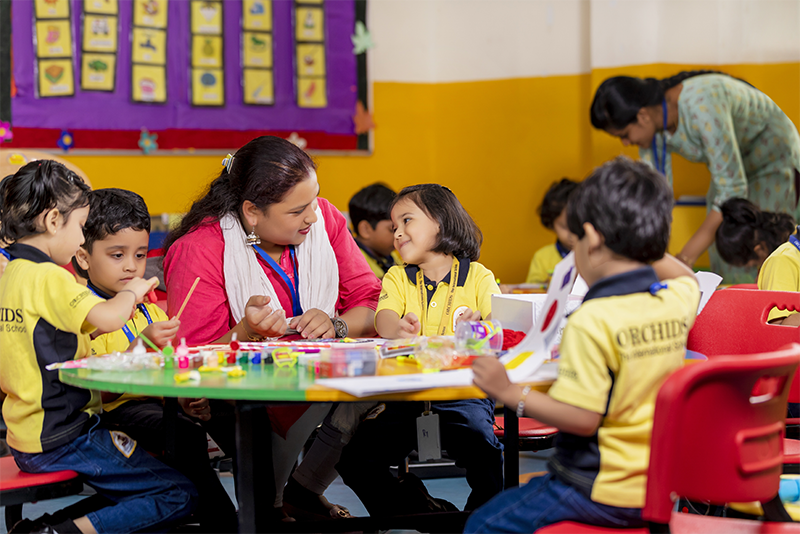
Photo courtesy: Pixabay
The pupil-teacher ratio—the average number of pupils per teacher—fell from 27 in 2018-19 to 19 in 2025-26, well below the 30:1 benchmark set by the National Education Policy 2020
There is a number to celebrate: there are fewer pupils for every teacher than there were seven years ago. But the more important story lies behind that national average. The improvement is real, yet uneven, and many schools still do not have enough teachers in their classrooms.
The pupil-teacher ratio (PTR) has fallen from 27 in 2018-19 to 19 in 2025-26, comfortably below the 30:1 benchmark set by the National Education Policy (NEP) 2020. That is genuine progress. But averages can hide as much as they reveal.
Himachal Pradesh and Uttarakhand reported PTRs below 15, among the best in the country. Delhi, despite being one of the country’s major higher-education centres, had a ratio of 27. The contrast points to a familiar weakness in the education system: having enough teachers in aggregate does not mean having them in the schools where they are most needed.
Himachal Pradesh illustrates the problem. Despite its favourable PTR, thousands of government schools have only one teacher, while 5,209 teaching posts remain vacant. A state can therefore look well staffed on paper while individual schools struggle to provide adequate teaching.

The teaching workforce itself has been growing. The number of teachers rose from 94.83 lakh in 2022-23 to 98.08 lakh in 2023-24, 1.01 crore in 2024-25 and 1.03 crore in 2025-26. That is an increase of 8.3 per cent between 2022-23 and 2025-26.
Women have been an important part of this expansion. Their growing presence in the teaching workforce matters for reasons beyond the headcount. In less urbanised parts of the country, women teachers can make schools more accessible and welcoming, particularly for girls.
But representation cannot compensate for absence. A girl in a village school gains little from a favourable national PTR if her own school has a single teacher handling several classes.
The improvement is visible across the stages of schooling. The PTR is 10 at the foundational level, 12 at the preparatory level, 17 at the middle level and 21 at the secondary level. All four are below the NEP’s 30:1 benchmark.

The numbers are reassuring, but the harder question is what happens inside the classroom. A school with one teacher handling several classes is a very different proposition from one where teachers are available for each grade and subject.
That is why the national ratio needs to be read with some caution. It captures the overall supply of teachers, but not how effectively they are distributed. Vacancies, uneven deployment and single-teacher schools can all weaken the benefit of a better national ratio.
There is, then, a familiar problem here: the headline number is improving faster than the experience on the ground.
A PTR of 19 is a useful achievement. It shows that the teaching workforce has expanded and that the country has moved well below the policy benchmark. But it cannot tell us whether a particular school has enough teachers, whether vacancies have been filled or whether children are receiving the attention they need.
That should shape the next phase of education policy. The task is no longer simply to improve the national ratio. It is to distribute teachers better, fill vacant posts and ensure that schools, particularly those in remote areas, are not left short-handed.
The progress is real. So is the gap.
The better measure of success is not how many teachers there are on paper, but whether there is a teacher standing in front of every classroom that needs one.